Event Management System
Metroscope detects equipment faults by comparing digital models against real sensor data from industrial plants.
Its core value: catch problems early before they cause production loss.
Fault detections existed as raw graphs only. The entire data presentation approach needed rethinking—operators couldn't answer basic questions: "What's broken? What matters most? What do I do first?"
This wasn't a UI problem. It was a fundamental redesign of how critical information flows to users. Manual synthesis of complex data created bottlenecks, especially on large plants with dozens of daily alerts.
Company
Metroscope
Team
1 product designer, 1 PM, 5 devellopers, 1 data scientist
Timeframe
Feb 2024–Present
Confidentiality note
Additional visuals and detailed specifications cannot be shared due to confidentiality agreements
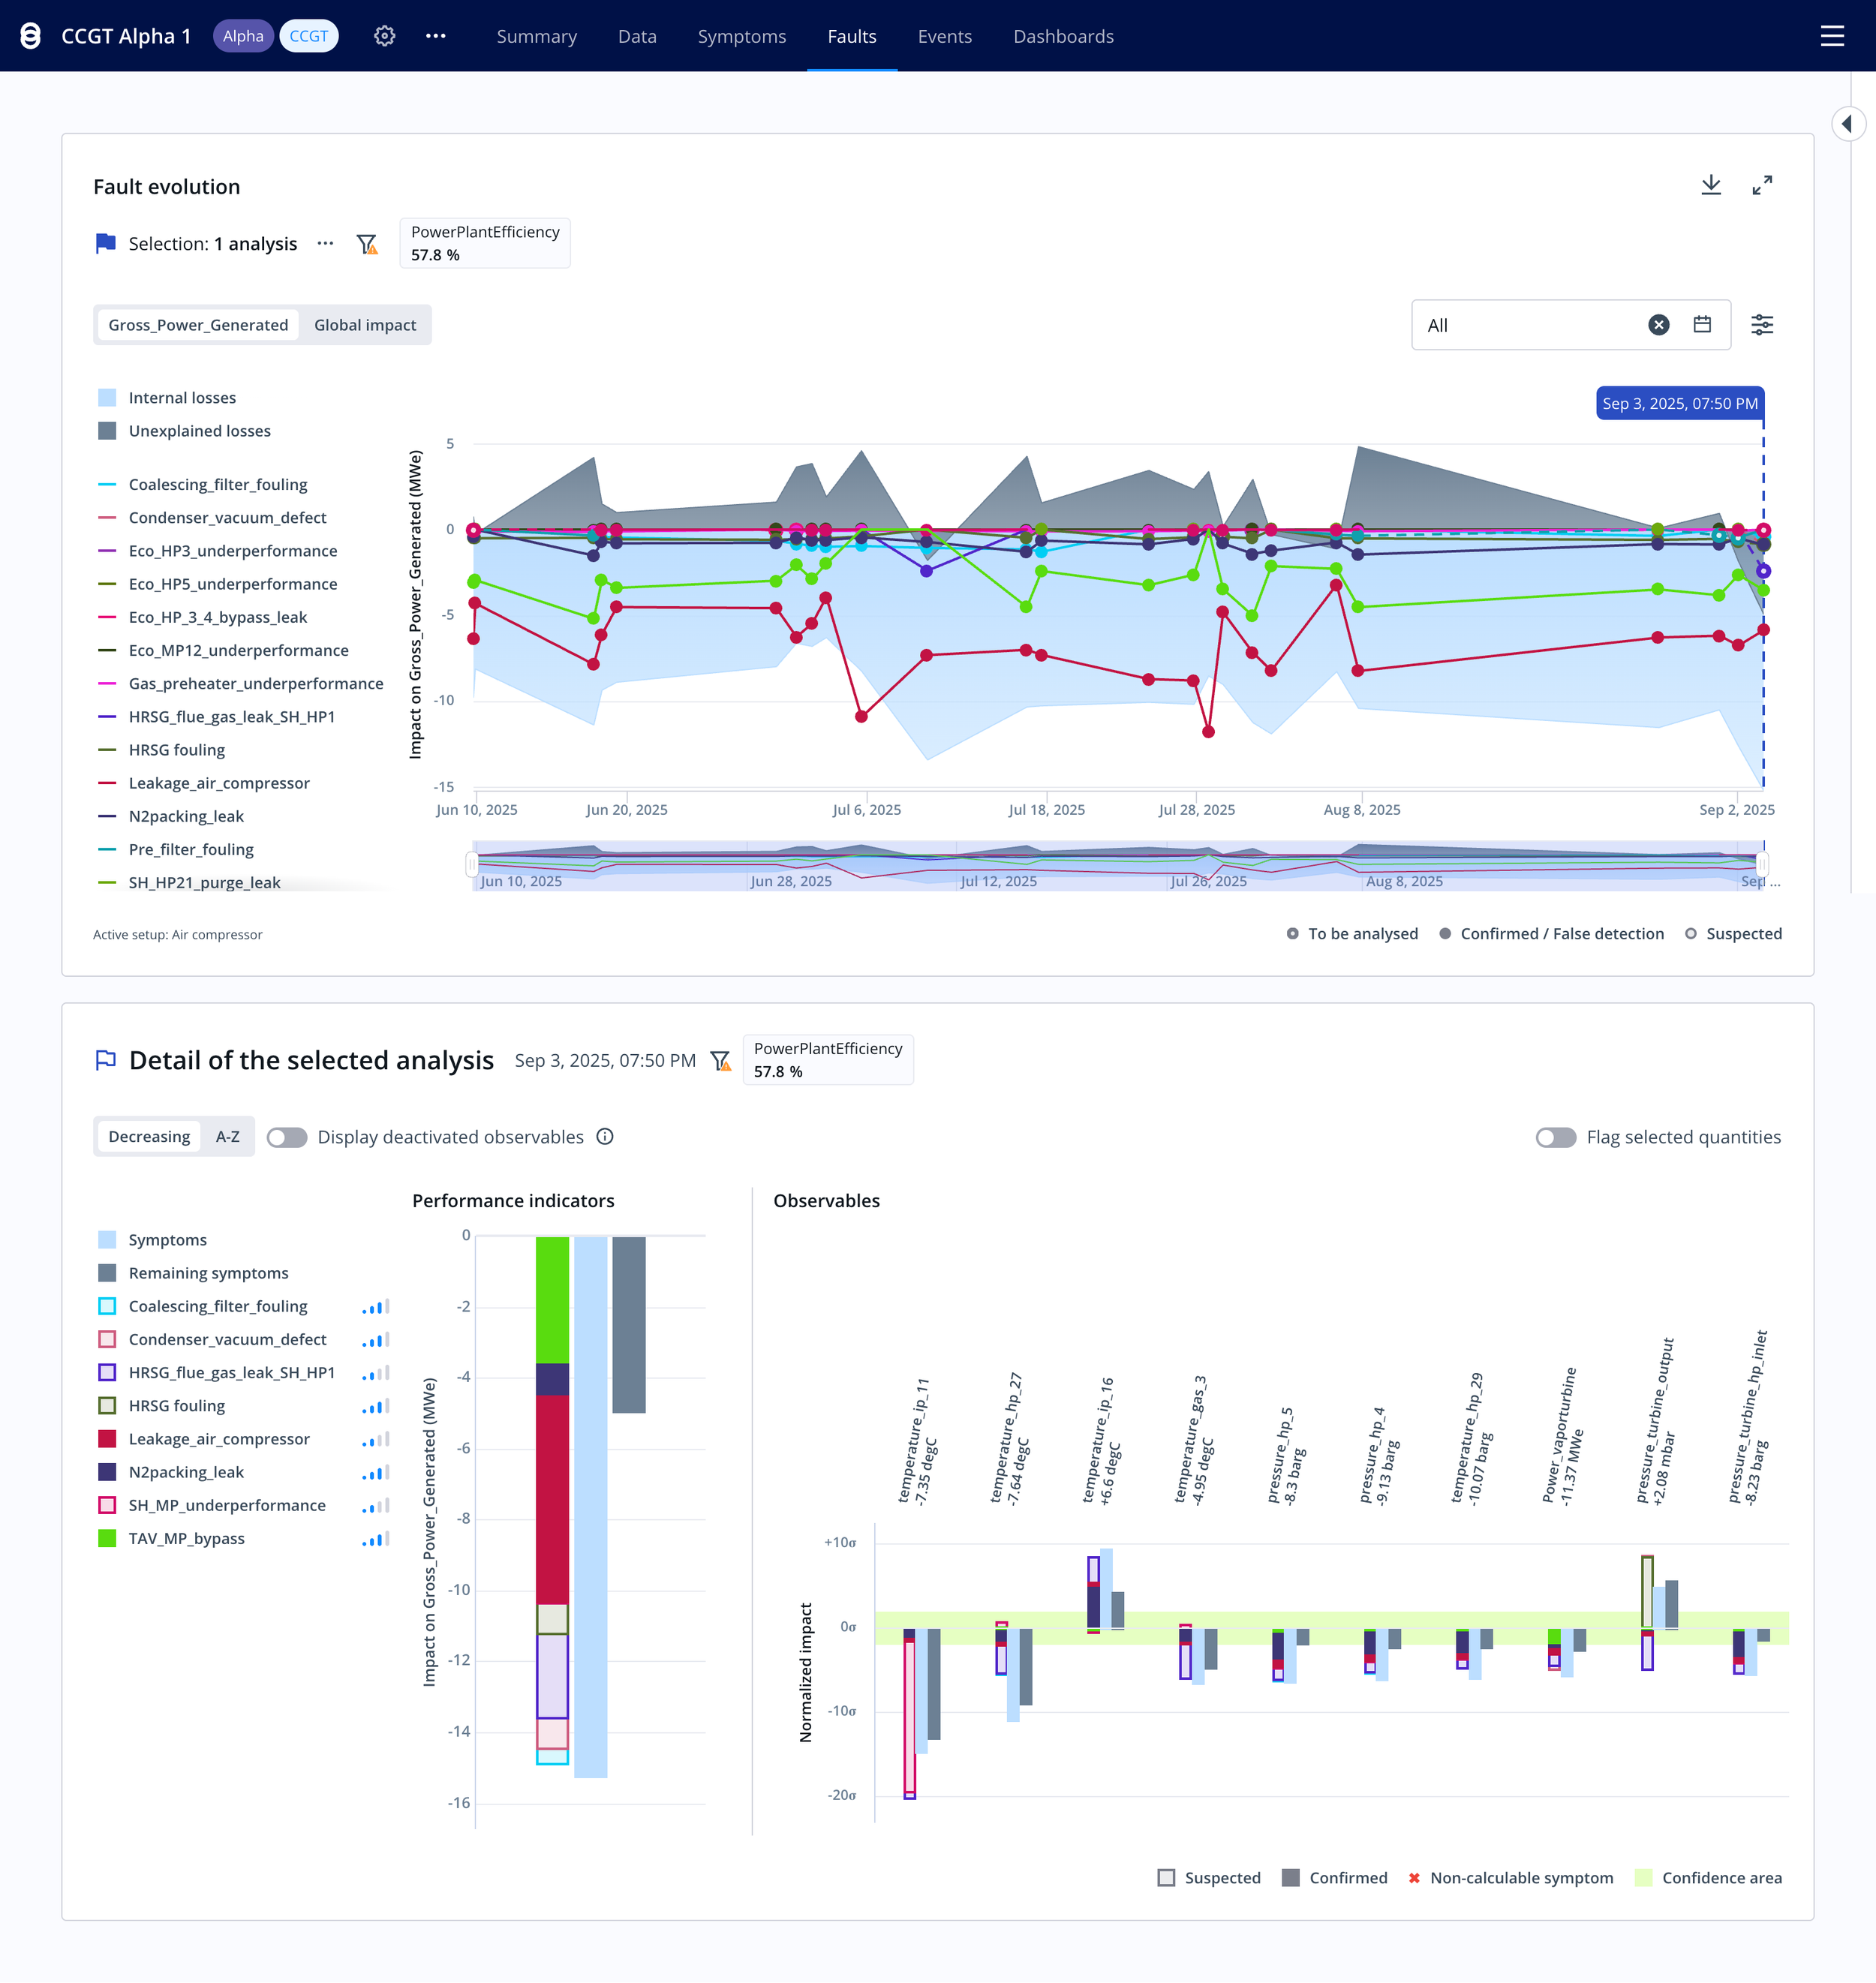
Current results graph (fault tab) & new events list (events tab)

Research & Discovery
Benchmarked industrial tools and competitors to understand how similar products present complex operational data. Aligned on familiar patterns to reduce learning curve and meet industry expectations.
Three validation phases:
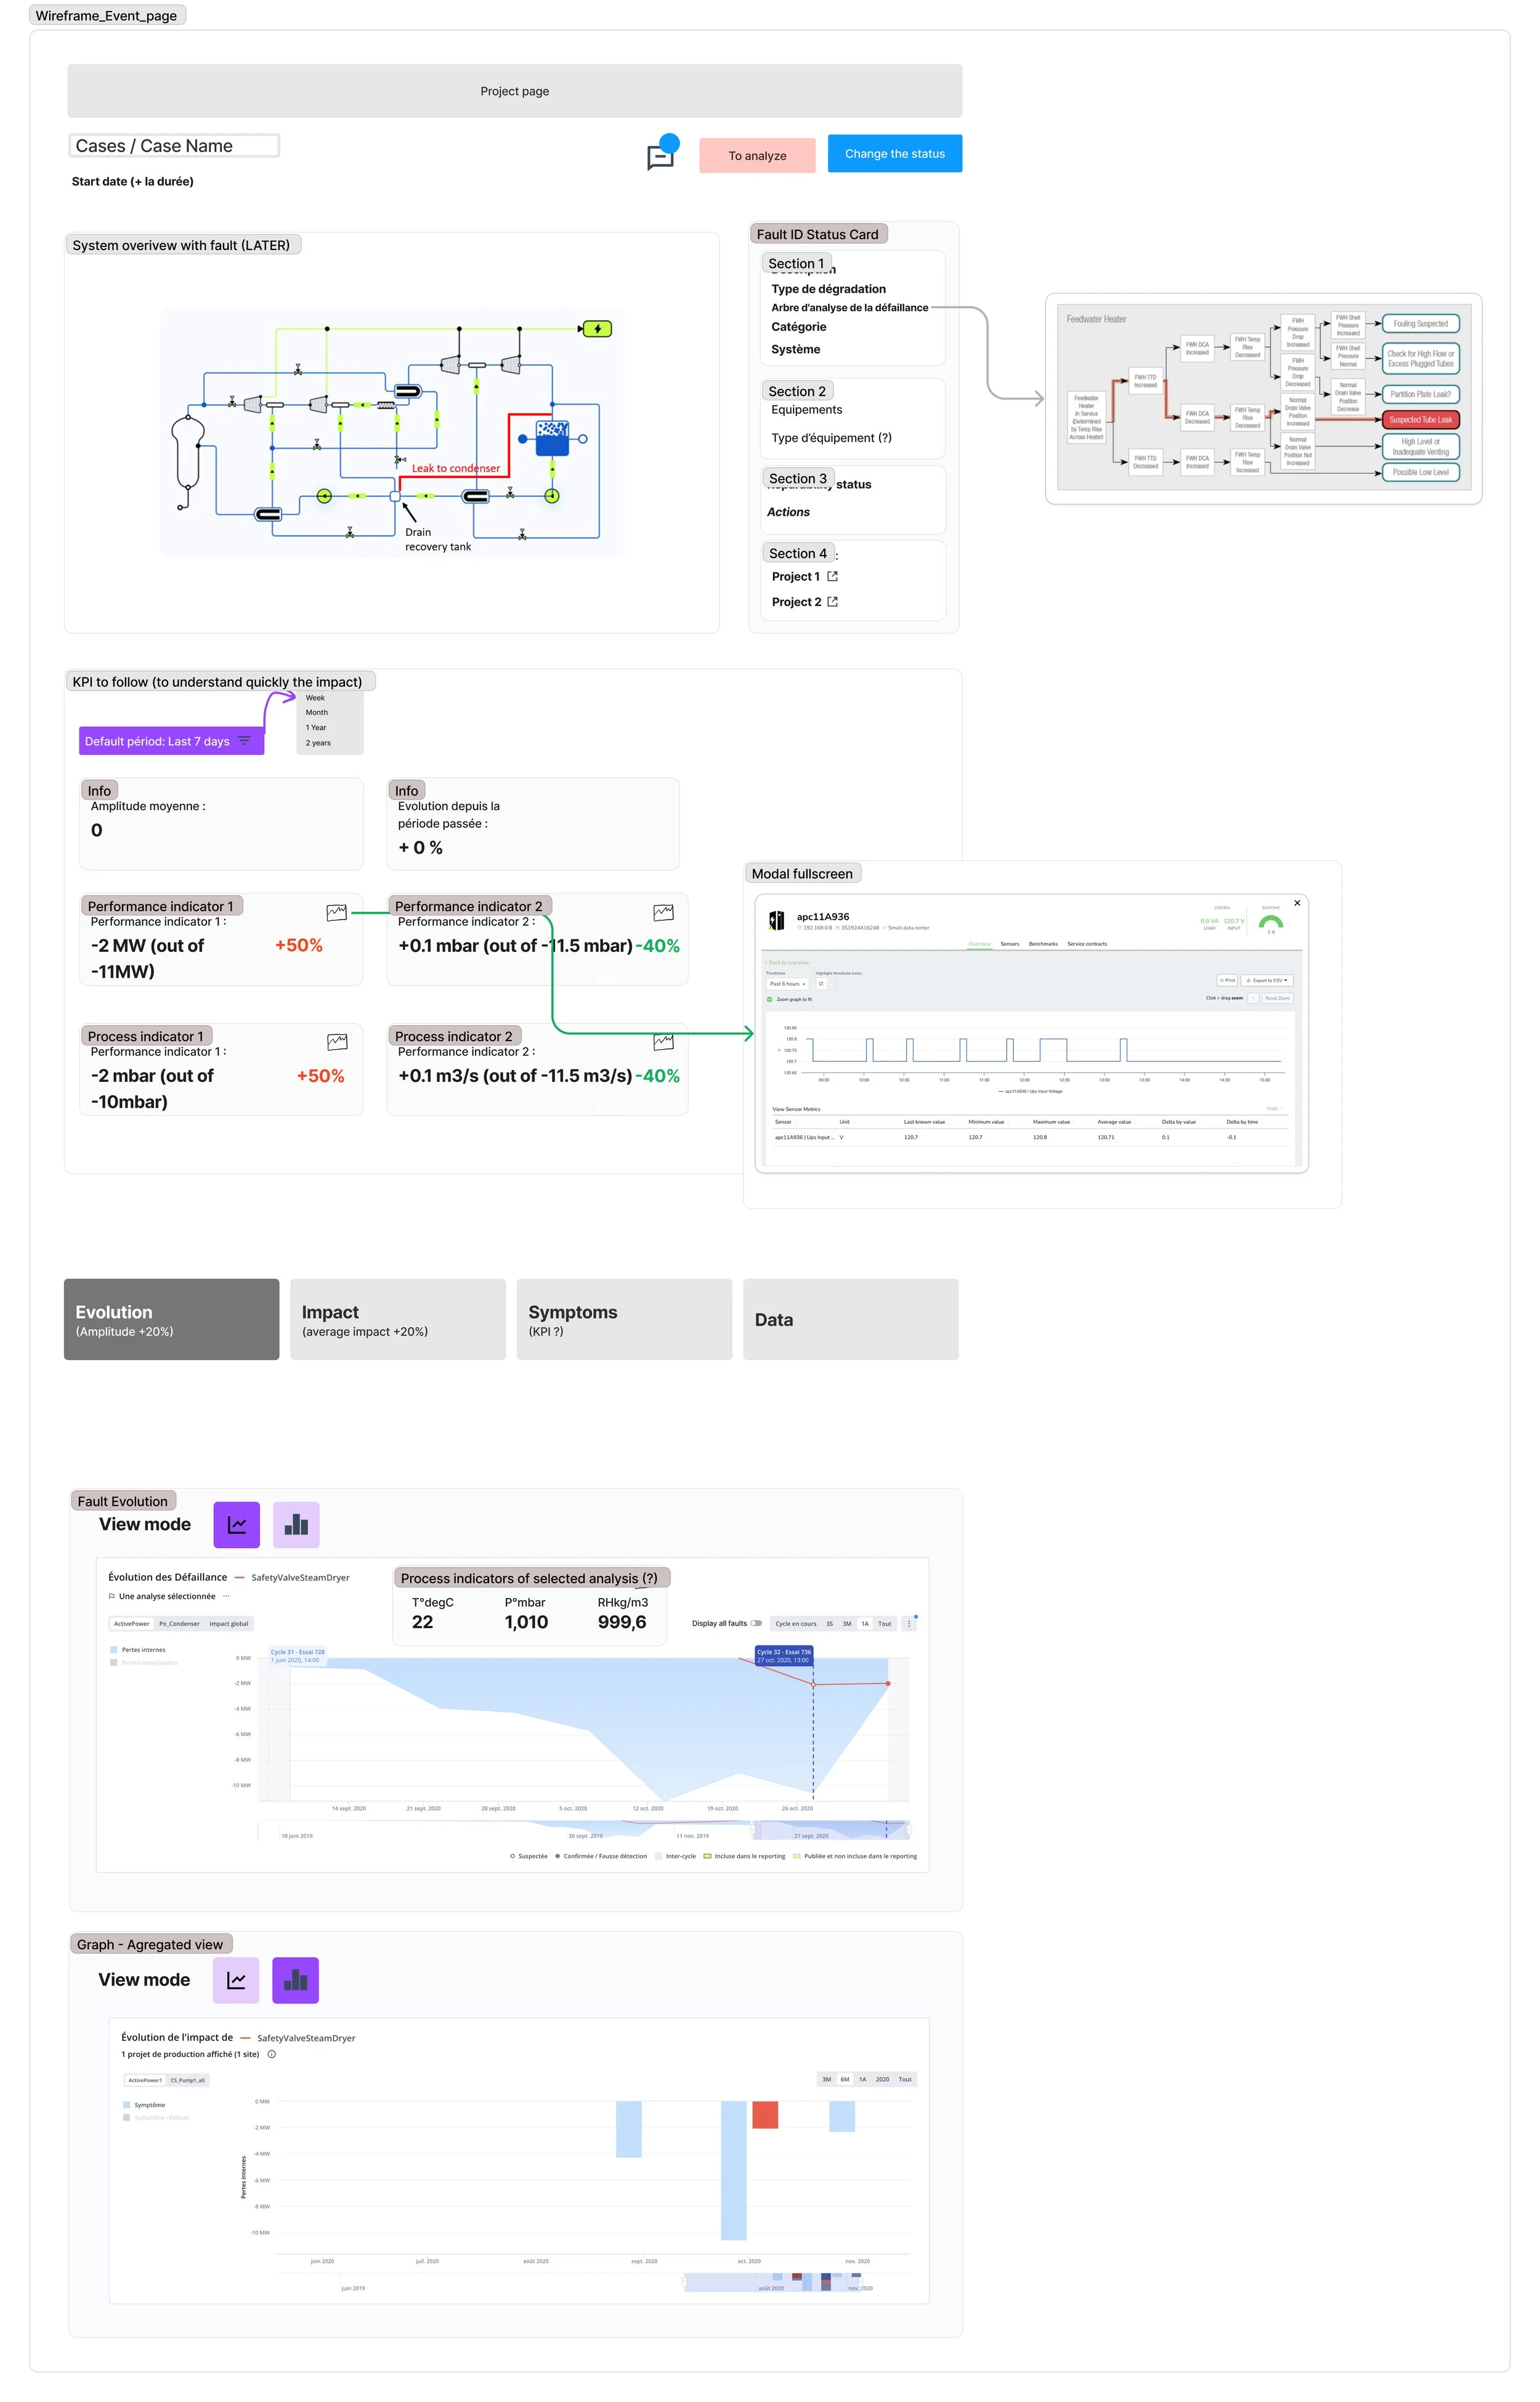
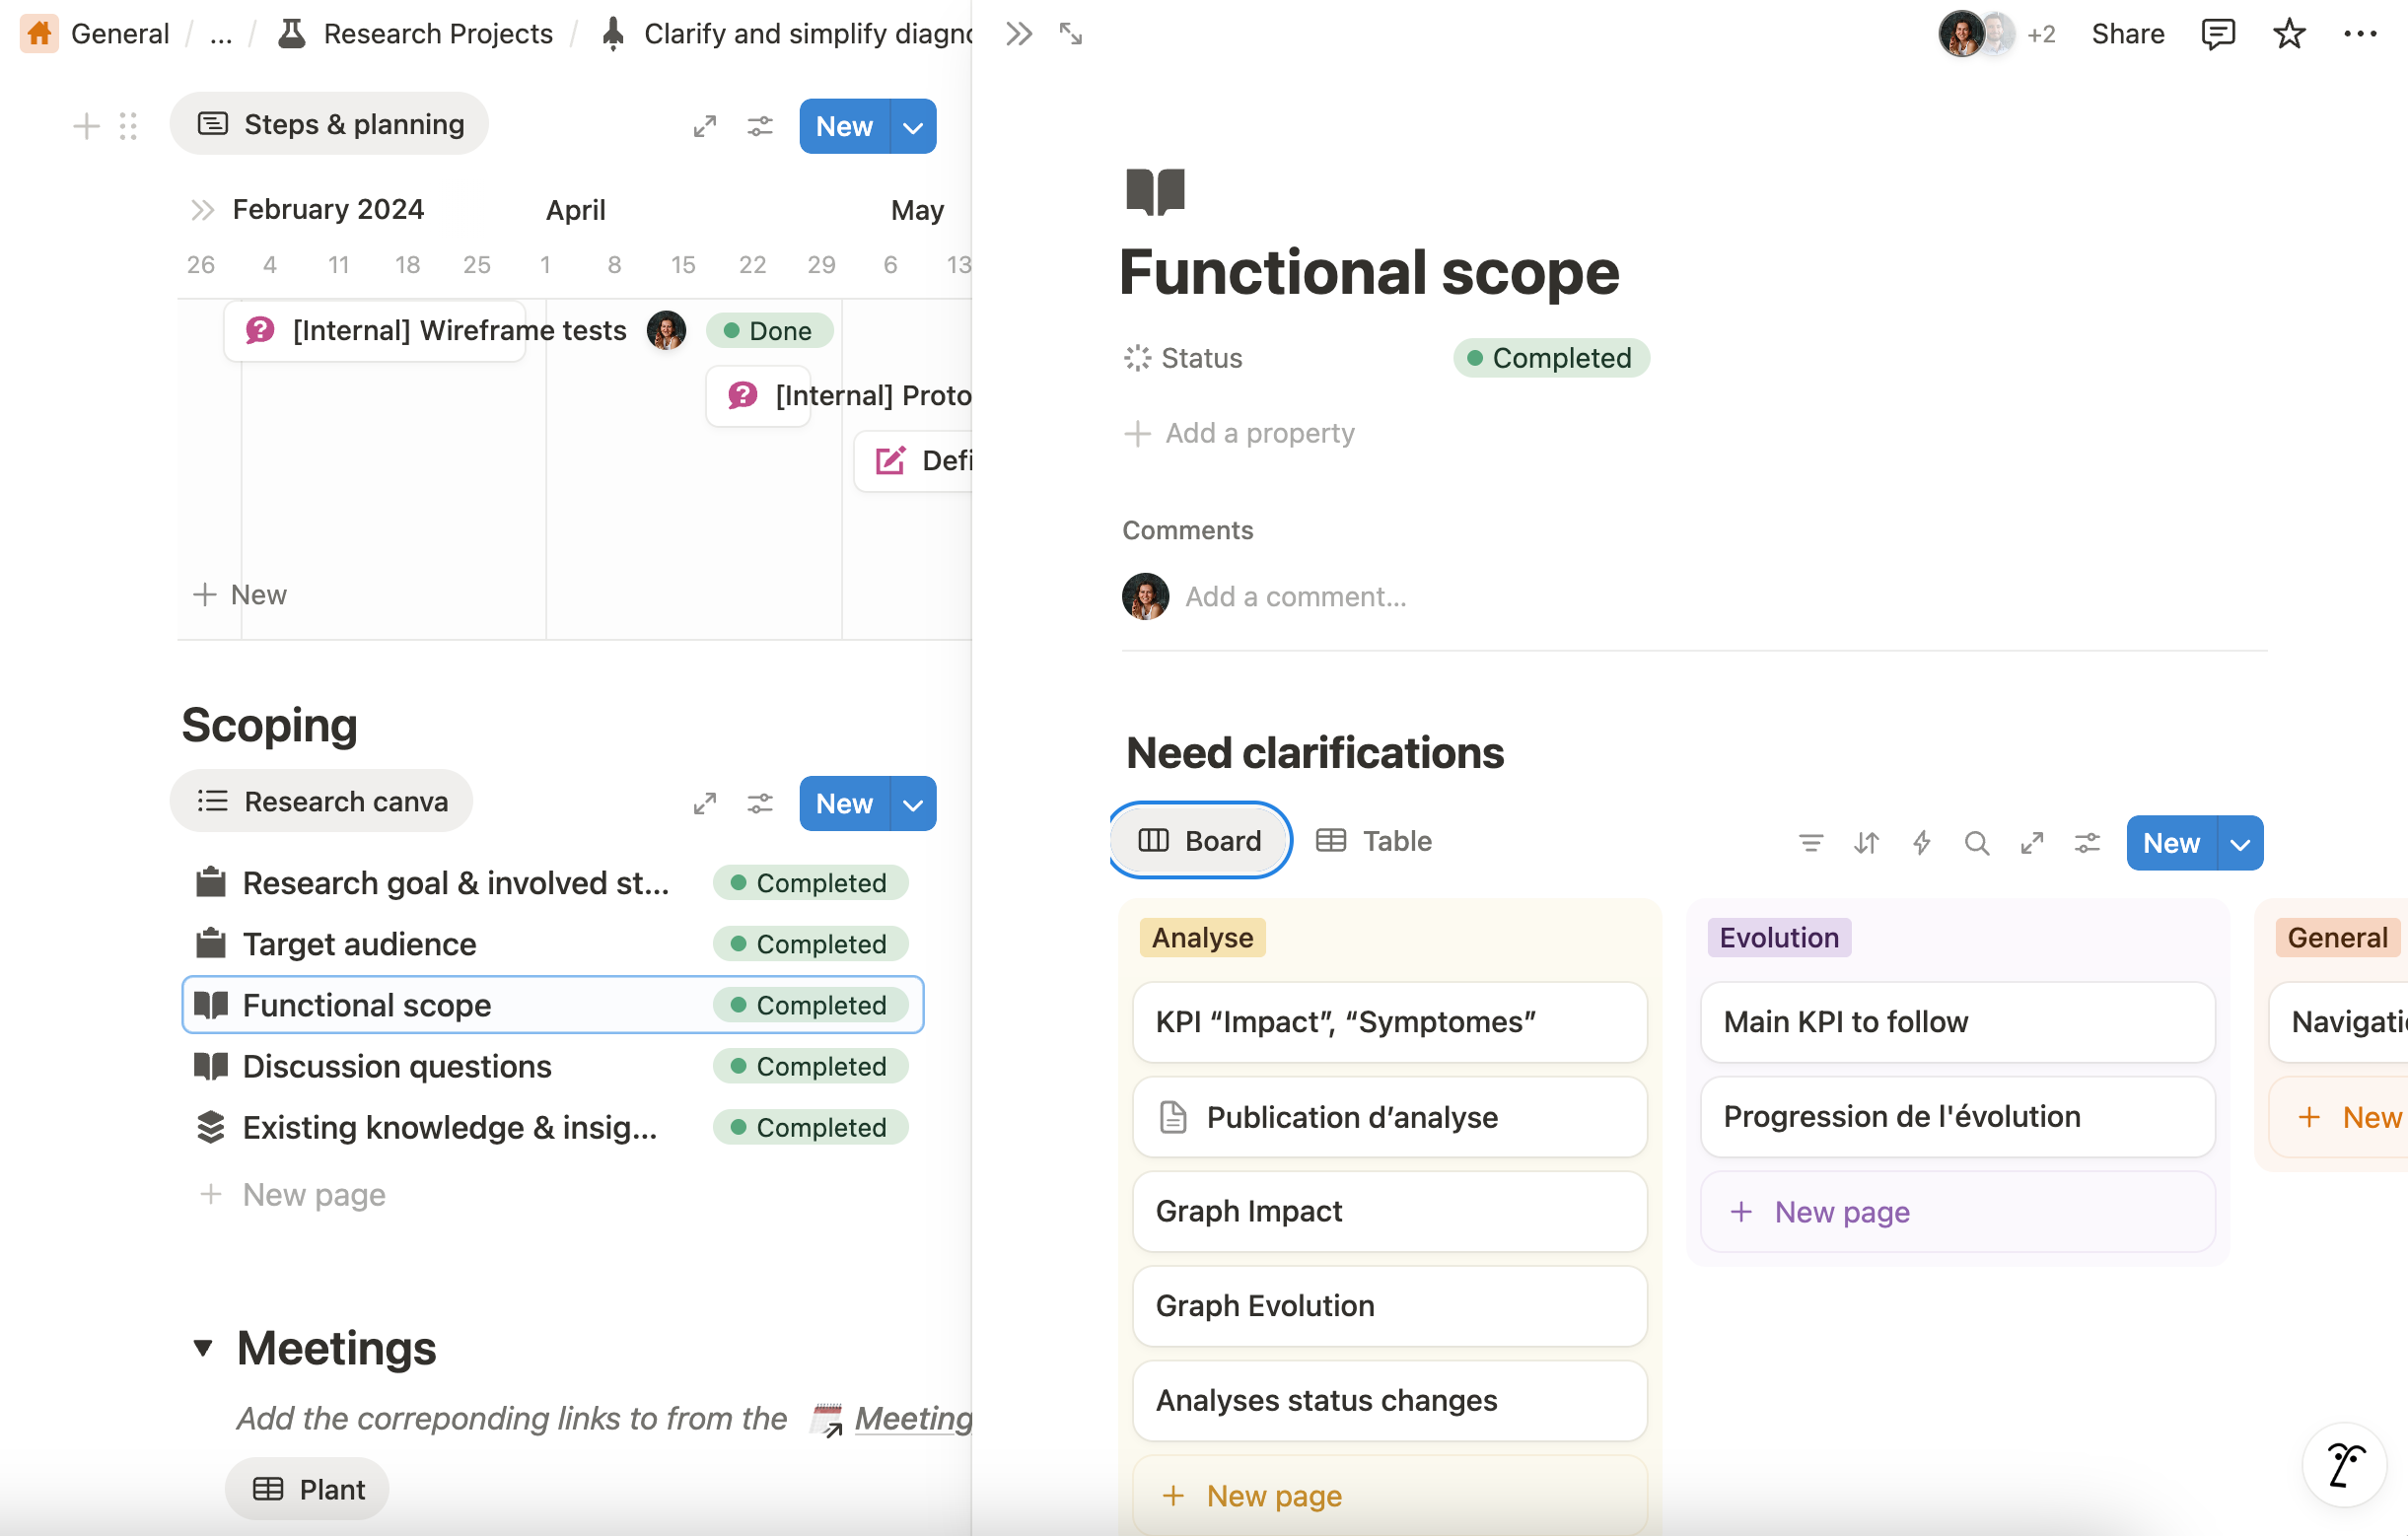
Ideation (Feb–June) – Wireframes tested internally (9 users) with leadership. Validated data aggregation methods with Data Scientists and developers to ensure calculations were feasible and accurate.
External validation (July–Aug) – Confirmed workflows with 3 key clients.
Alpha/Beta (Sept 2024–Feb 2025) – Once solutions was devellopped, run internal alpha tests and 8-user beta to test real adoption.
Owned UX writing throughout: Clear, precise language was critical—operators needed to understand event states, priority signals, and action implications instantly in high-pressure environments.
Early collaboration with Data Science and Engineering ensured technical feasibility—new data structures were needed to support this approach.
Solution
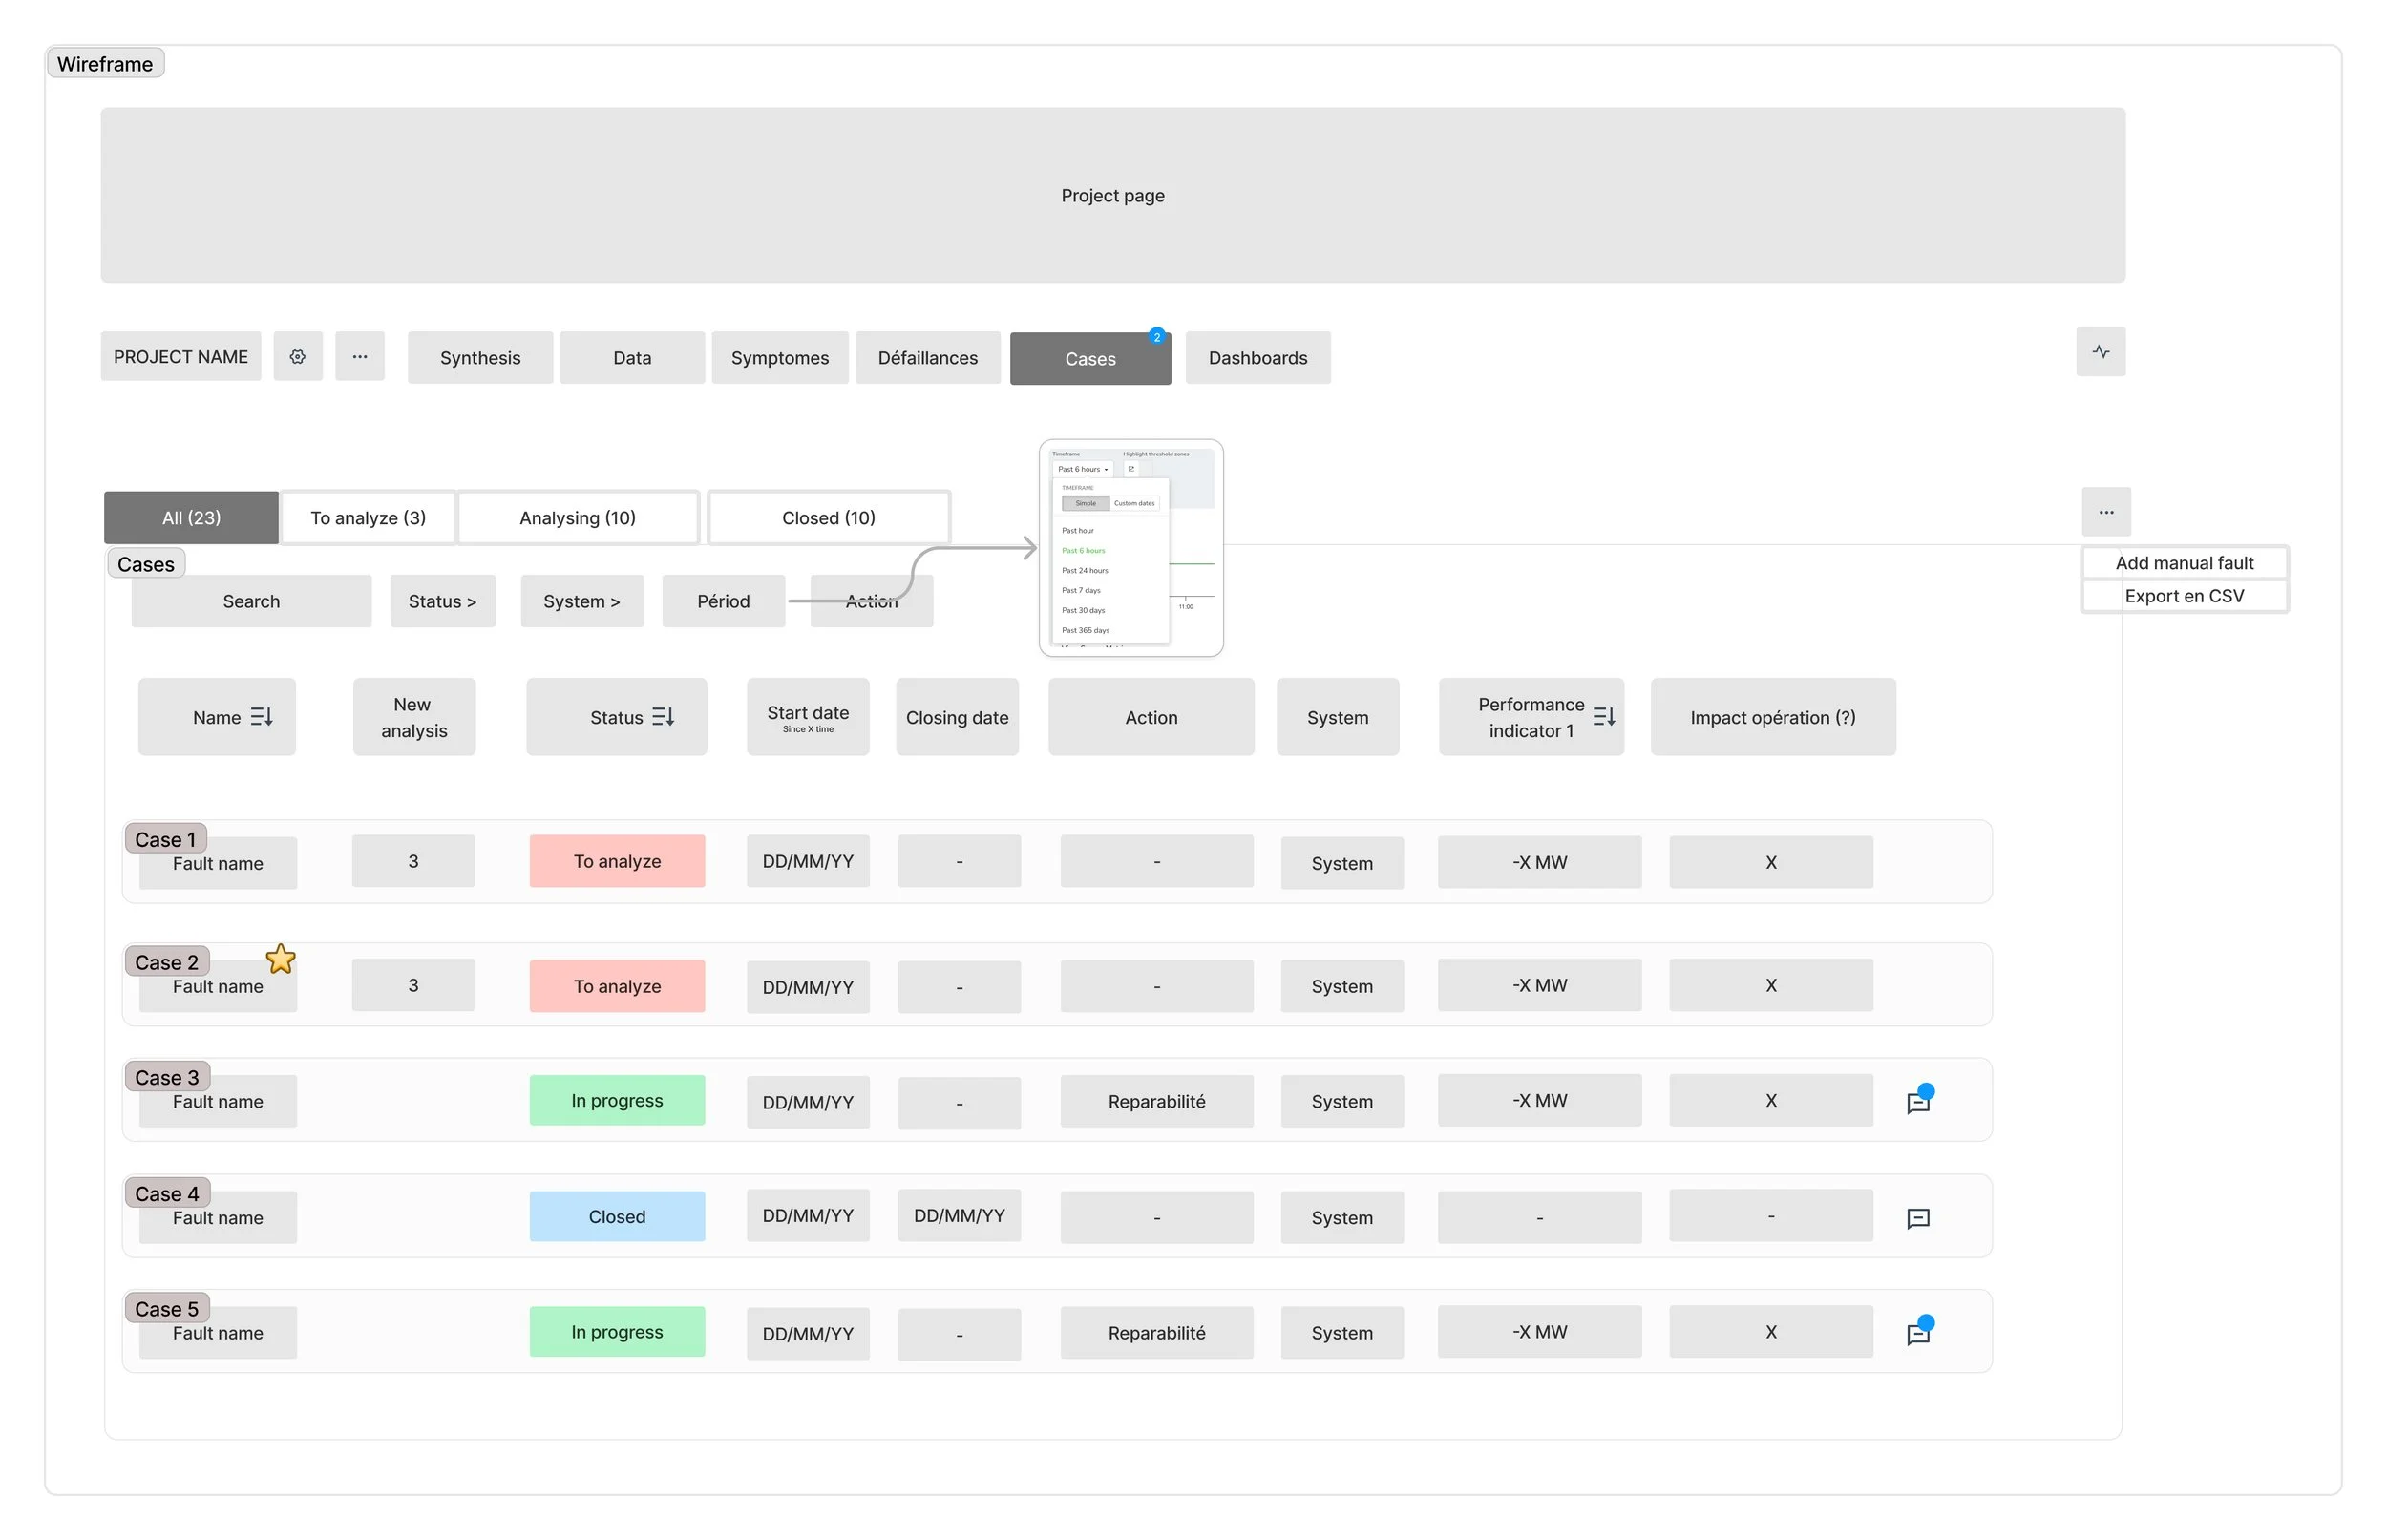
Events List: Summary widgets (priority breakdown, loss trends, system health) + scannable event list.
Event Detail: Compact summary with progressive access to history, context, related events, and custom dashboards for deeper analysis.
Collaboration built-in: Comments and action tracking keep teams aligned on ongoing investigations.
Outcomes
Live since March 2025 across client environments
Progressive rollout with ongoing feedback
Redefined core data architecture to enable event tracking across platform
Lessons
Observe how users actually work: excel sheets revealed true mental model—better than asking what they wanted.
Validate early, iterate often: internal testing caught direction issues; external beta revealed missing features specification missed.
Adoption is a feature itself: introducing a new workflow fundamentally changes how operators interact with the software. Worked closely with Customer Support and Project teams throughout alpha and beta to prepare training, manage expectations, and support different experience levels. Not every customer adopts innovation at the same pace—segmented rollout and hands-on support were critical to success.
Design and architecture must align: early dev involvement prevented rework after implementation started.